Stop guessing your retirement.
Start planning it.
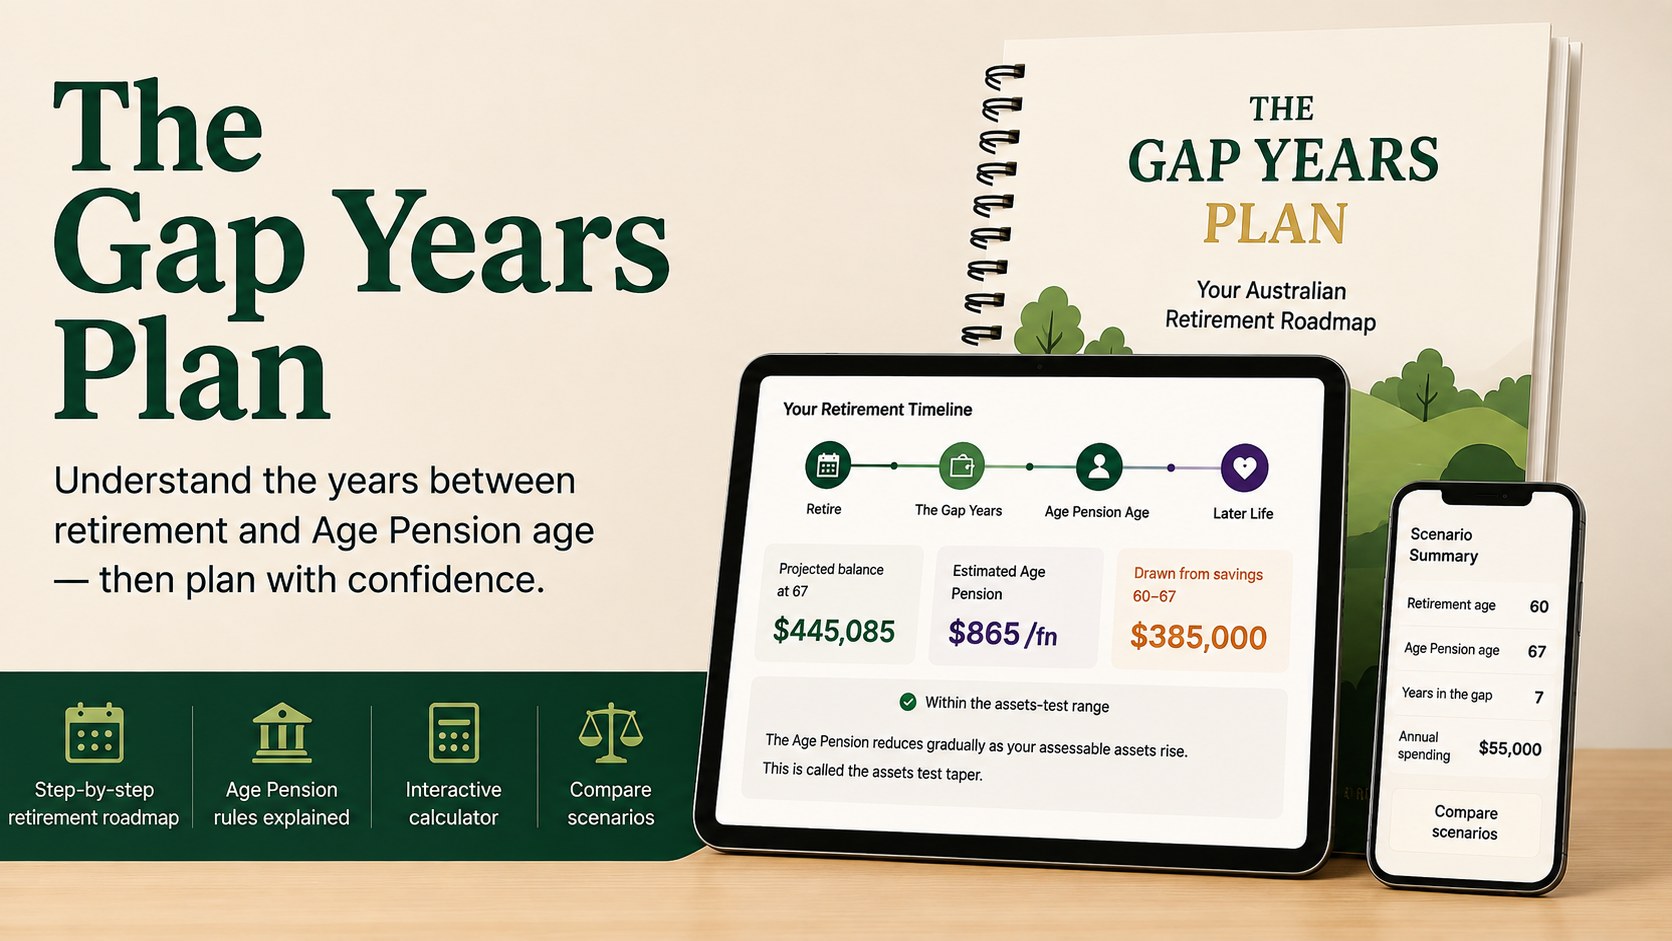
A plain-English Australian retirement workbook with an interactive calculator that runs on your own numbers — from preparing to retire, through the gap between stopping work and Age Pension age, and into life on the pension.
Get the plan — AU$29Instant access · Current figures · Your numbers stay on your device
- Every figure traced to a named source
- Models both the income and assets tests
- Your numbers never leave your browser
Seven years nobody plans for
You can reach your super at 60. You cannot claim the Age Pension until 67. Nobody designed the years in between — they are what is left over between two sets of rules.
Stop work at 60 spending $50,000 a year and those seven years cost $350,000 before you claim a single dollar of Age Pension. Retire at 62 instead and the same spending costs $250,000. For most people it is the largest single expense of their retirement, and it arrives before any government support does.
A worked example at $50,000 a year, not a projection of your own position. The calculator runs your actual numbers.
- 55–60Before you retire
- 60Access your super
- 60–67The gap yearsNo pension yet
- 67Age Pension
- 67+Drawing it down
- —After you
What's inside
A workbook you read and a calculator you use, in one place. Enter your figures once; every section then shows your own numbers.
Your retirement timeline
The stages from preparing to retire, through the gap years, into Age Pension age and beyond — with your own dates and balances against each.
The gap years
What the years before 67 actually cost, how much comes out of savings each year, and what you would arrive at Age Pension age holding.
Both pension tests
Centrelink runs an income test and an assets test and pays the lower result. See which one is limiting you, and what deeming and the Work Bonus do to the answer.
Compare scenarios
Change your retirement age or add part-time work and see the paths side by side — what each gives up as well as what it gains.
Twelve plain-English chapters
From accessing your super to what happens to your partner, written without jargon and with every figure dated.
Nothing leaves your device
No accounts, no database. Your figures are saved in your own browser, and there is an Export button if you want a copy.
What Australians are asking
Real comments from the Aussie Invest with Jack channel. These are the questions the workbook was built to answer.
“However, between 60 and 67, if you are going to apply for jobseeker, it needs to be in accumulation rather than account based pension. It will be invisible to Centrelink when applying for jobseeker.”
@paulelvey4648 · YouTube comment
“I think you should've included ‘potential earnings’ while self funding from 60 to 67 years old. That in itself could dramatically alter how much draw down from your super.”
@markandkim66 · YouTube comment
“The idea of deliberately reducing one's wealth to $333k by 67 in order to qualify for the aged pension feels counter-intuitive.”
@ProNoober8 · YouTube comment
“67 is ridiculous, I've already got one foot in the grave. Should be 60.”
@glennschadow-gw7qc · 3 likes
“My super can go up or down 10k in a week whether I draw on it or not. That creates an elation/panic loop… I think market stability is important if you are looking at a higher spending limit.”
@stephenH2490 · YouTube comment
“I'm 61 — if I had $500k I'd be gone this afternoon… it's enough.”
@thomasryan4490 · YouTube comment
Figures that don't go stale
That last one is why guides built on a two-date cycle carry cut-off figures that are wrong every July. The workbook is updated at each of those dates, and because your figures are saved you re-enter nothing — open it after an indexation and your position has already been recalculated.
Sources & methodology
Where the numbers come from, and how they stay right.
Australian retirement rules are scattered across government websites, calculators and policy documents, and different figures change on different dates. The Gap Years Plan brings the pieces that matter into one place, in plain English, and then lets you put your own numbers in.
Every figure in the workbook is traced to a named published source and dated. The explanations and the calculator read their numbers from the same rates file, so the figures you read and the figures in your own results come from one place.
- Government sources
- Services Australia · Australian Taxation Office
- Industry benchmark
- ASFA Retirement Standard — an industry body, not a government source
- Written in
- Plain English, with every figure dated and its source listed inside the workbook
General information only. Not personal financial advice, and not endorsed by Services Australia, the ATO or the Australian Government.
Ready to see your own timeline?
One purchase. The workbook, the calculator, and every future rate update.
AU$29
Get the Gap Years Plan- Interactive Age Pension calculator
- Income and assets test modelling
- Scenario comparison
- Twelve plain-English chapters